CIO Dashboard Kit
The CEO, the CFO and the board each ask different questions about technology, and too often get different numbers. This kit keeps one set of measures and gives each audience its own one-page view, with the comment that says what the month means.
$69 $35 one-time, no subscription
Excel, PowerPoint and Word files. Yours to use and adapt inside your organisation. Delivered by email at once; 14-day refund promise.
5 working files, not a slide pack to read
Every file is editable and comes with a worked example for one fictional company, so you start from something, not from a blank page. Workbooks calculate as you type.
 Excel
CIO dashboard workbook
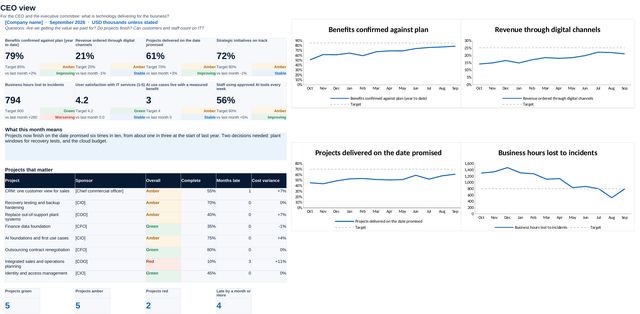
13 sheets: 38 measures with definition, owner, source, target and margin; a calculation sheet for value, status, trend, year to date and the last 12 months; CEO, CFO, board and CIO views with tiles, charts and commentary; projects, risks, budget forecasts and a data check. Pick the month and everything follows.
 PowerPoint
Executive dashboard pack
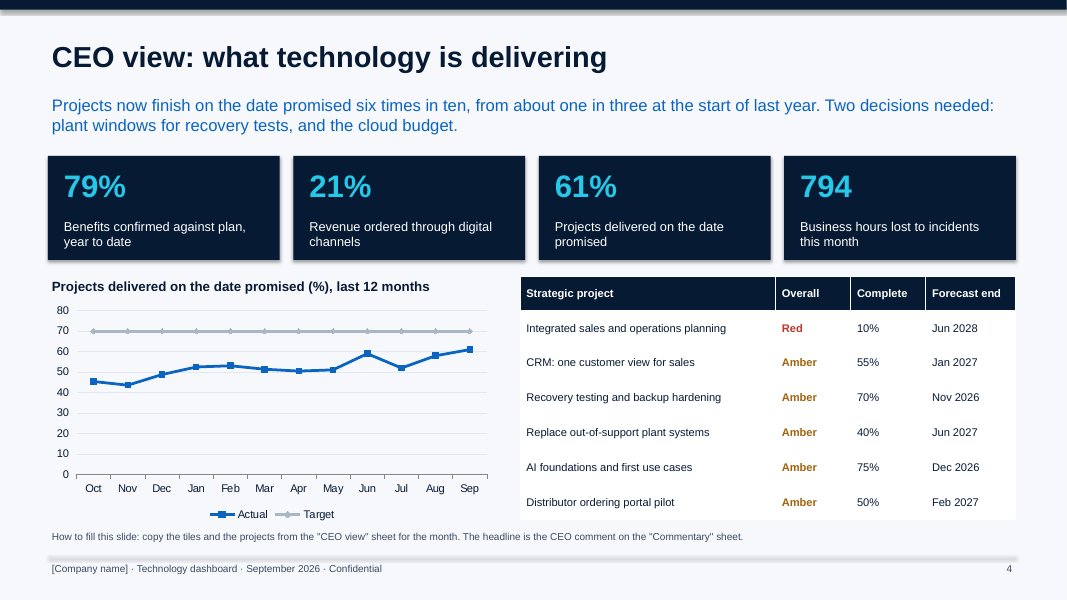
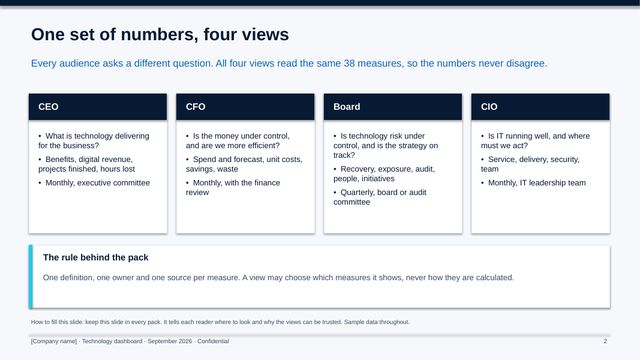
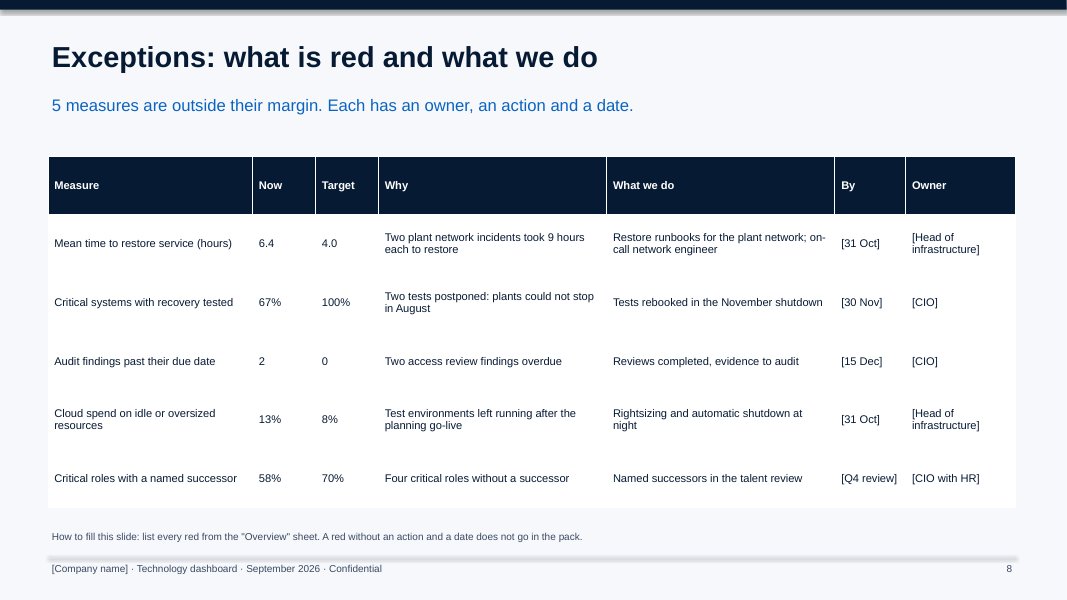
11 slides: the month on one page, the four views, exceptions with actions and dates, the decisions, how the pack is produced and how to read it.
 Word
Dashboard specification
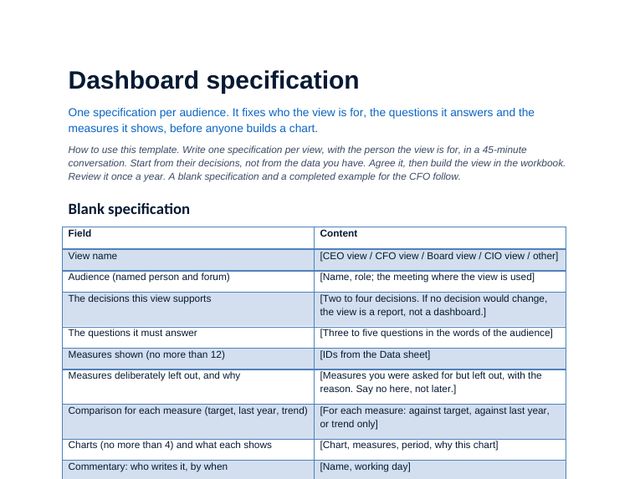
One page per audience: decisions, questions, measures in and out, charts and commentary. Completed example for the CFO view.
 Word
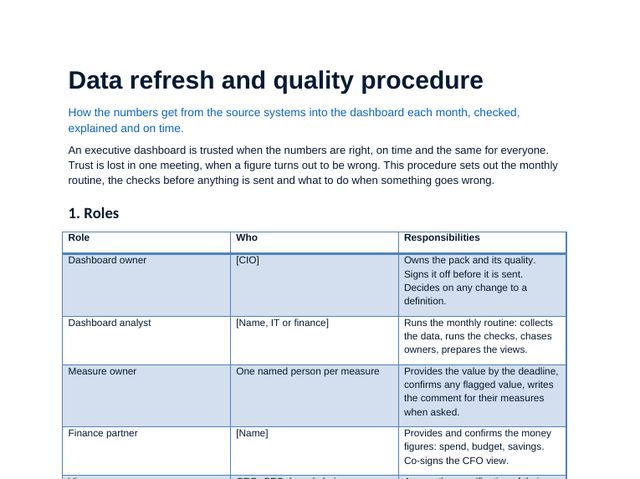
Data refresh and quality procedure
The six-day monthly routine, roles, checks before sending, how to write the comment and what to do when a figure is wrong.
 Guide
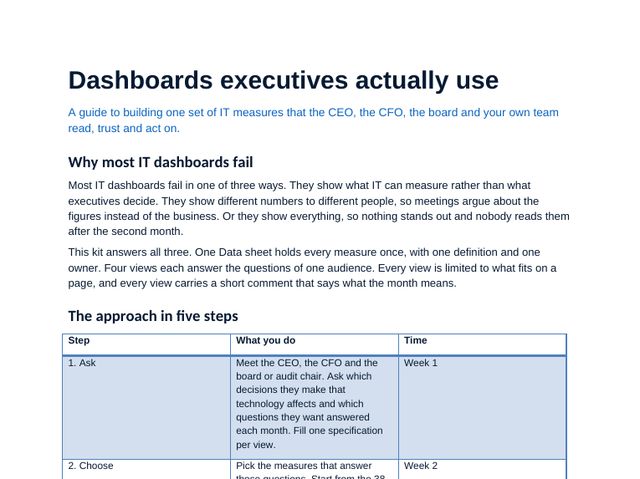
Dashboards executives actually use
What each audience needs, design rules, targets and margins, the mistakes to avoid and when to automate.
CIO dashboard workbook, sheet by sheet
The workbook carries the method: scores, choices and plans calculate as you type, and the dashboard and deck figures come from it. Click any image to see it full size.
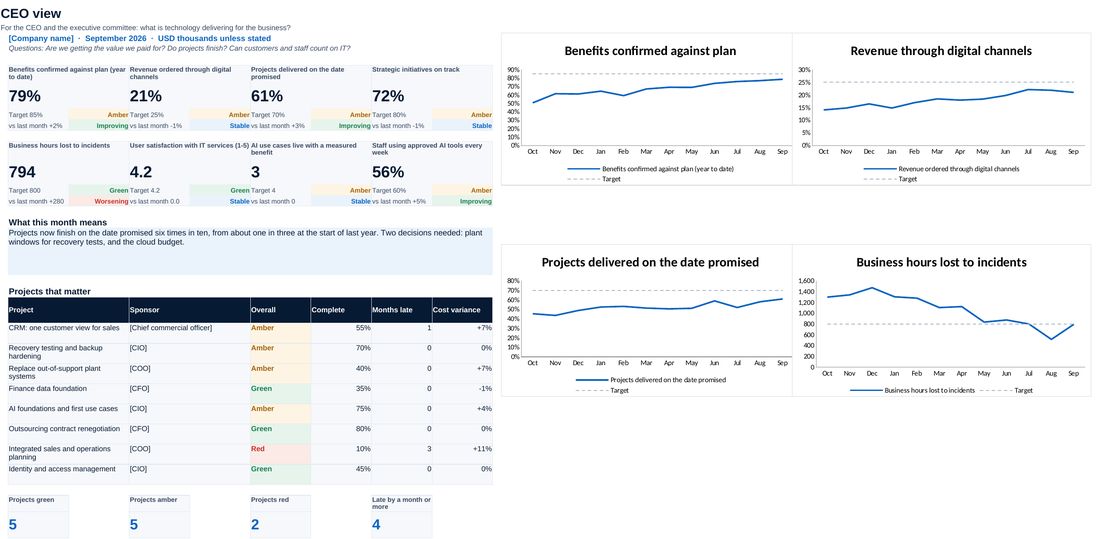
Value, delivery and customers, with projects that matter.
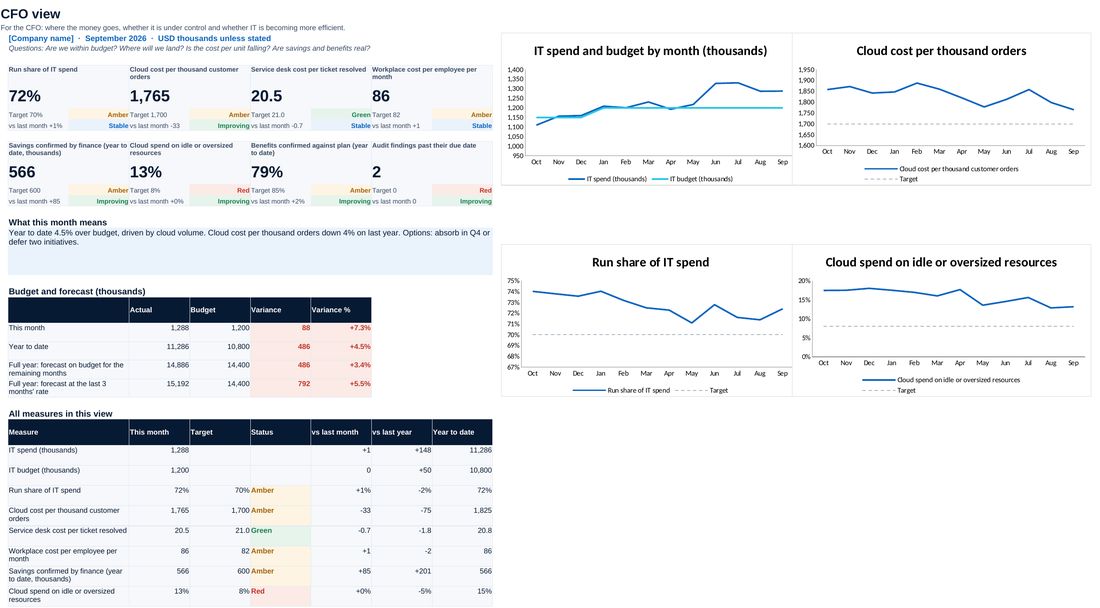
Spend against budget, two forecasts and unit costs.
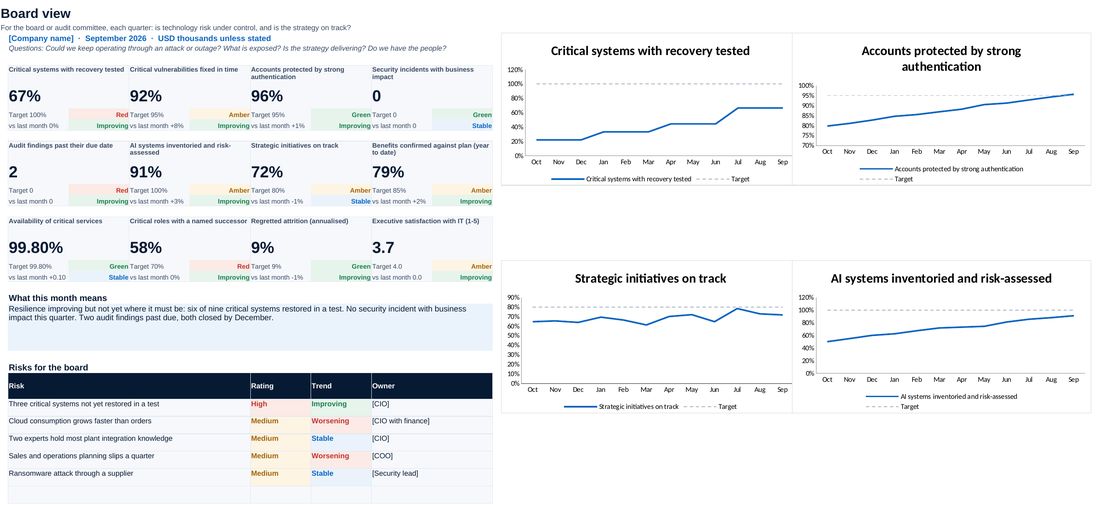
Resilience, exposure and the risks the board must own.
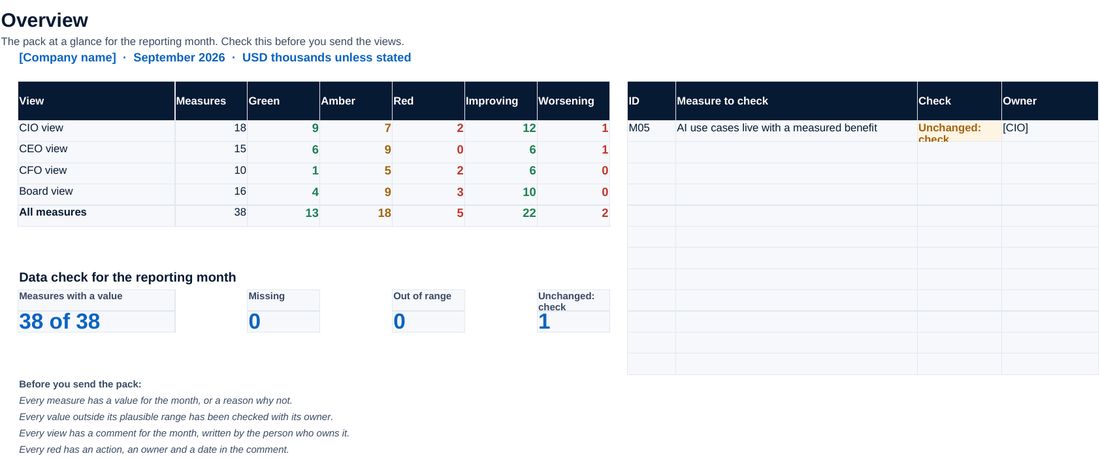
Status by view and the data check before the pack is sent.
Screenshots of the workbook with its sample data, opened in a spreadsheet application.
Four views, one set of numbers
Every view reads from the same calculation sheet, so the CEO and the CFO can never see different figures for the same measure. Each view fits on one page and leads with what the month means.
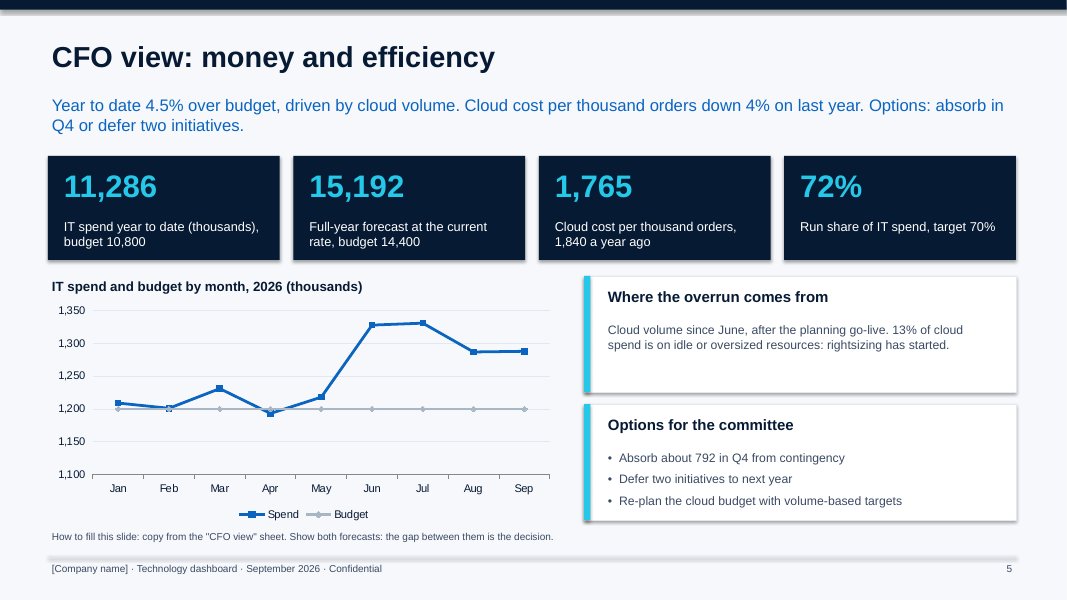
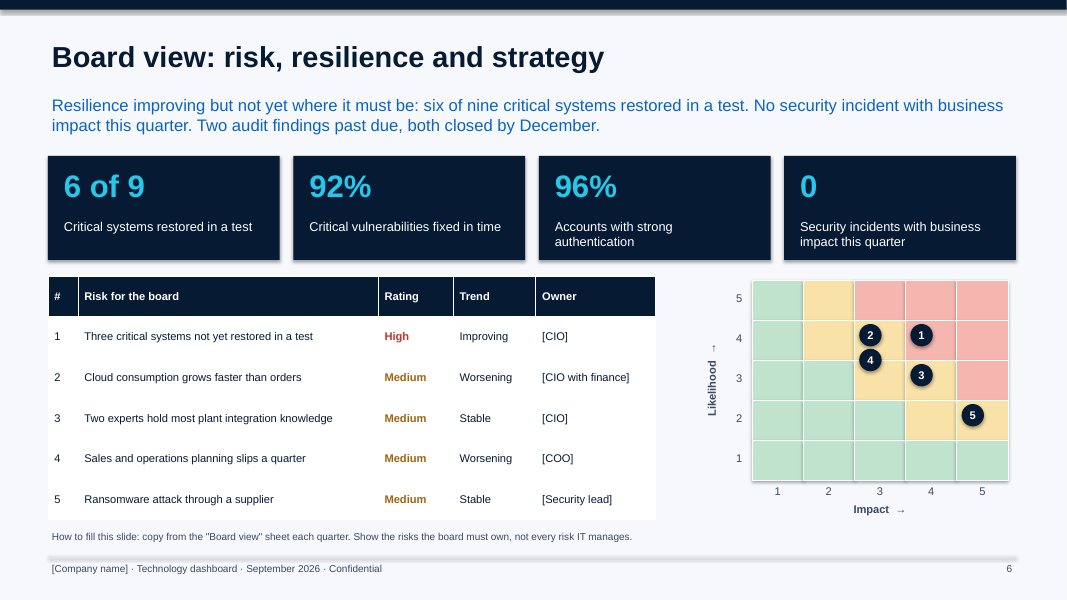
All figures shown are sample data.
The method, step by step
Meet the CEO, the CFO and the board chair; write one specification per view.
Pick the measures, owners and definitions; set targets and margins.
Enter twelve months of history and check each view with real numbers.
Show the drafts, then run the first monthly routine and send the pack.
Who it is for
- CIOs asked for "a dashboard" by the CEO or the board
- Heads of IT who report to a CFO
- IT finance, PMO and reporting leads
- Advisers preparing a client management pack (one licence per client organisation)
What you need
Excel, PowerPoint and Word, or compatible software. About a month to the first pack, then half a day a month.
Free guide on this topic
Questions about the kit
How is it different from the CIO KPI Kit?
The KPI Kit helps you choose and define the measures. This kit presents them: one view per audience, monthly, with commentary and checks. They work well together.
Does it connect to my systems?
No. It is a workbook you fill each month. Run it for a few months to learn which measures matter, then automate those in your reporting tool with the same definitions.
Can I change the measures and views?
Yes. Add measures on the Data sheet and point any tile or chart at them. Each view is an ordinary sheet you can edit.
How do I get it?
Checkout is run by Creem, our reseller and merchant of record, which also handles tax and your invoice. As soon as the payment is confirmed we email you a private link to download the kit. Not what you expected? Ask within 14 days for a full refund.
Is it legal or financial advice?
No. The templates are practical starting points for management decisions. Have policies and contracts reviewed against the law that applies to your company.
Who can use it?
You and your colleagues, inside your own organisation. Advisers need one licence per client organisation. Please do not resell or republish it.