GCC Cost Model
Most offshore decisions are made on a rate card: an engineer in Pune against an engineer at headquarters. The real case is never that simple. Two teams are paid during the parallel run, part of the work never moves, people leave and must be replaced, a captive takes a year to fill, a partner charges a fee and then a transfer fee, and severance falls in the first year. This free model prices the same scope four ways (outsource, build, operate and transfer, captive and a hybrid) over five years against what the work costs onshore today, with every line people forget, then tells you which option is cheapest, by how much, how fast it pays back and what would change the answer.
Free link sent to your inbox
Download the kit (ZIP, 0.7 MB)
Excel, PowerPoint and Word files. Yours to use and adapt inside your organisation.
4 working files, not a slide pack to read
Every file is editable and comes with a worked example for one fictional company, so you start from something, not from a blank page. Workbooks calculate as you type.
 Excel
GCC cost model
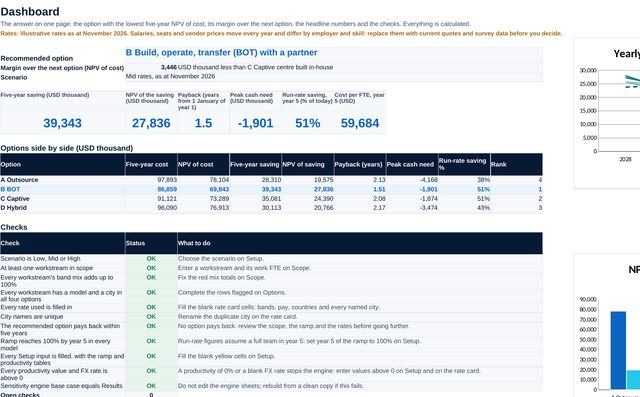
12 sheets: setup with every assumption and the ramp by model, a dashboard with the recommendation and its checks, a dated rate card (role bands, pay by country, cities, vendor rates), scope for up to 10 workstreams, four options by dropdown, results by cost line and year, city comparison, break-even, a Sensitivity sheet with a tornado of 11 drivers that reruns the whole model 22 times, an Option B partner cost base for the GCC Partner RFP Pack, and the two calculation engines.
 PowerPoint
GCC cost case summary
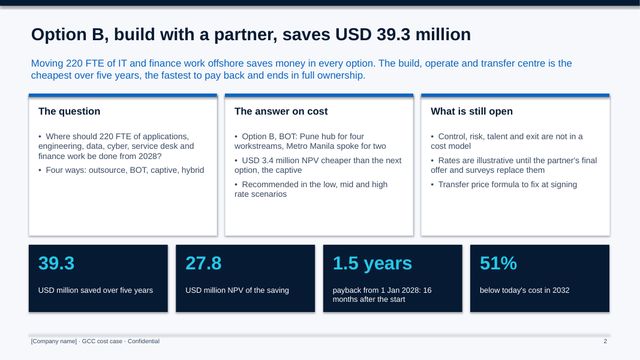
11 slides for the executive committee: the answer, the scope, four options, five-year cost and saving, payback and peak cash, cost per FTE by city, what moves the answer, what cost does not tell you, next steps and the decisions.
 Word
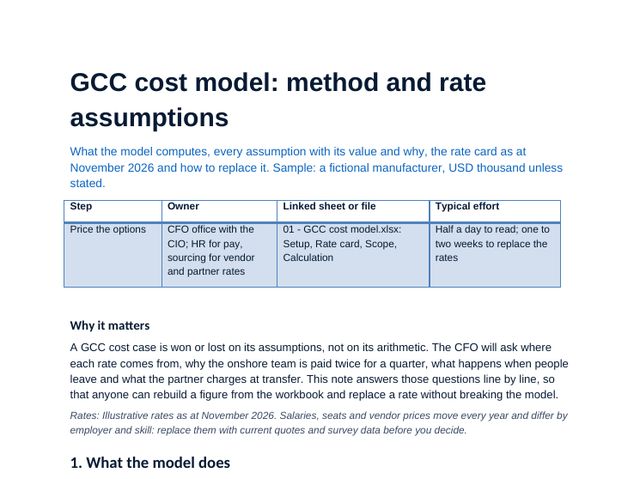
GCC cost model method and rate assumptions
What the model computes, every assumption with its value and why, the rate card and how to replace it, the method for each cost line and one FTE in Pune and in Manila from base pay to loaded cost.
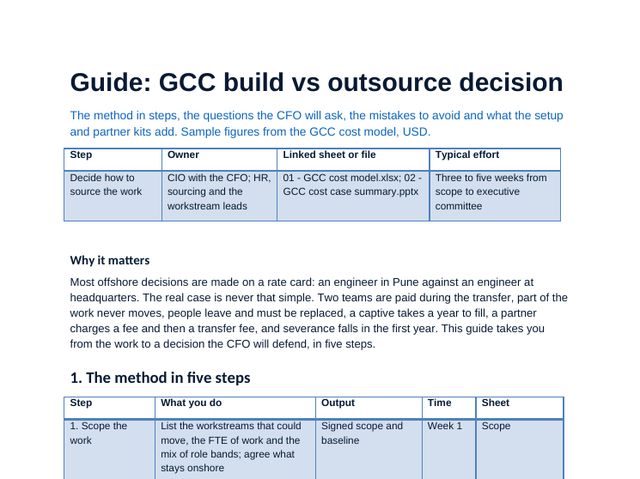 Guide
GCC build vs outsource decision
The method in five steps, the questions the CFO will ask, the mistakes to avoid and what the setup and partner kits add.
GCC cost model, sheet by sheet
The workbook carries the method: scores, choices and plans calculate as you type, and the dashboard and deck figures come from it. Click any image to see it full size.
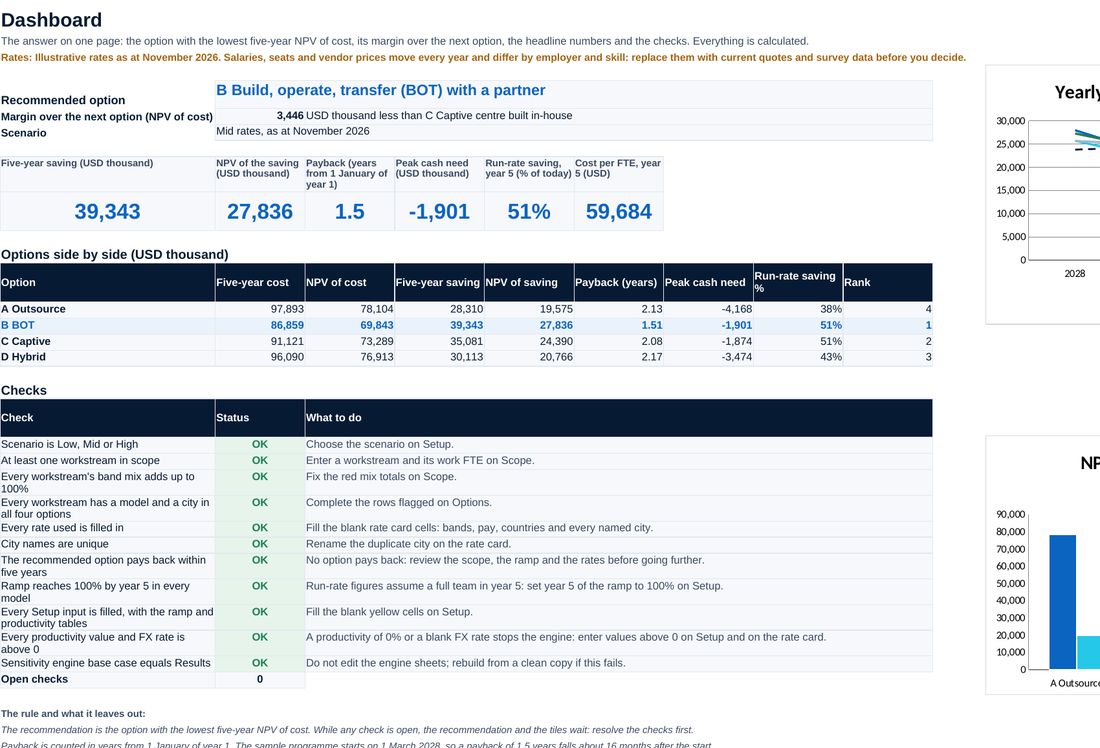
The recommended option, its margin over the next one, saving, NPV, payback, peak cash need and the checks.
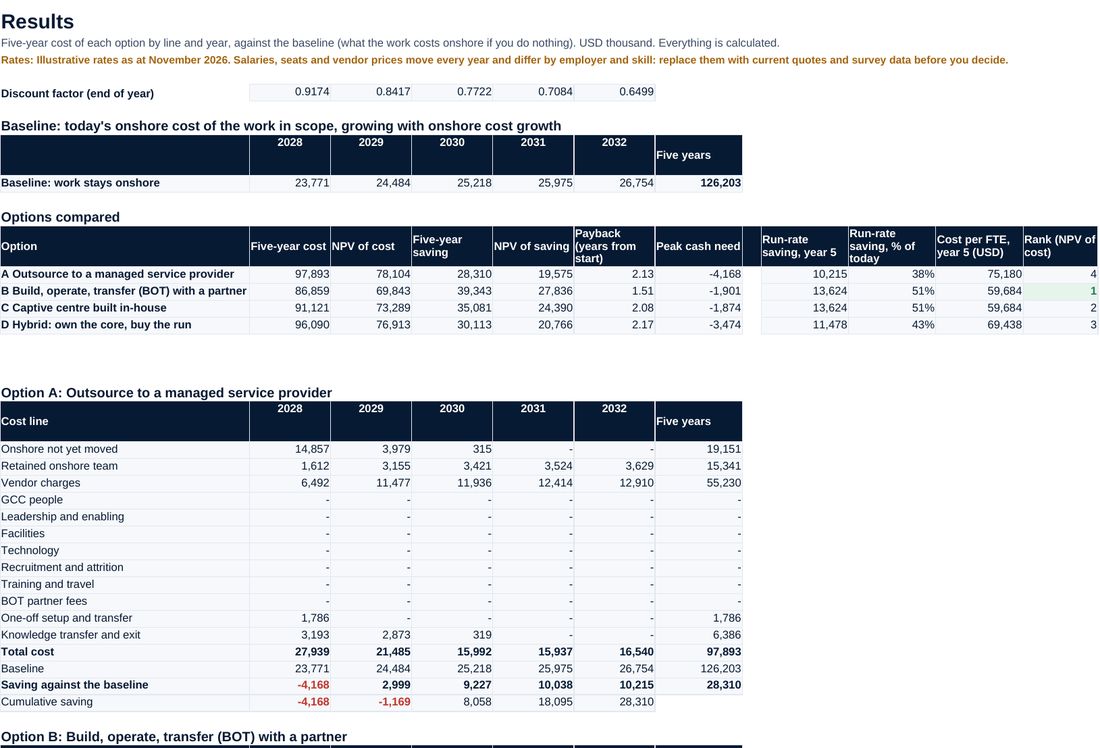
Every cost line of every option by year against the baseline, with NPV, payback, run-rate saving and cost per FTE.
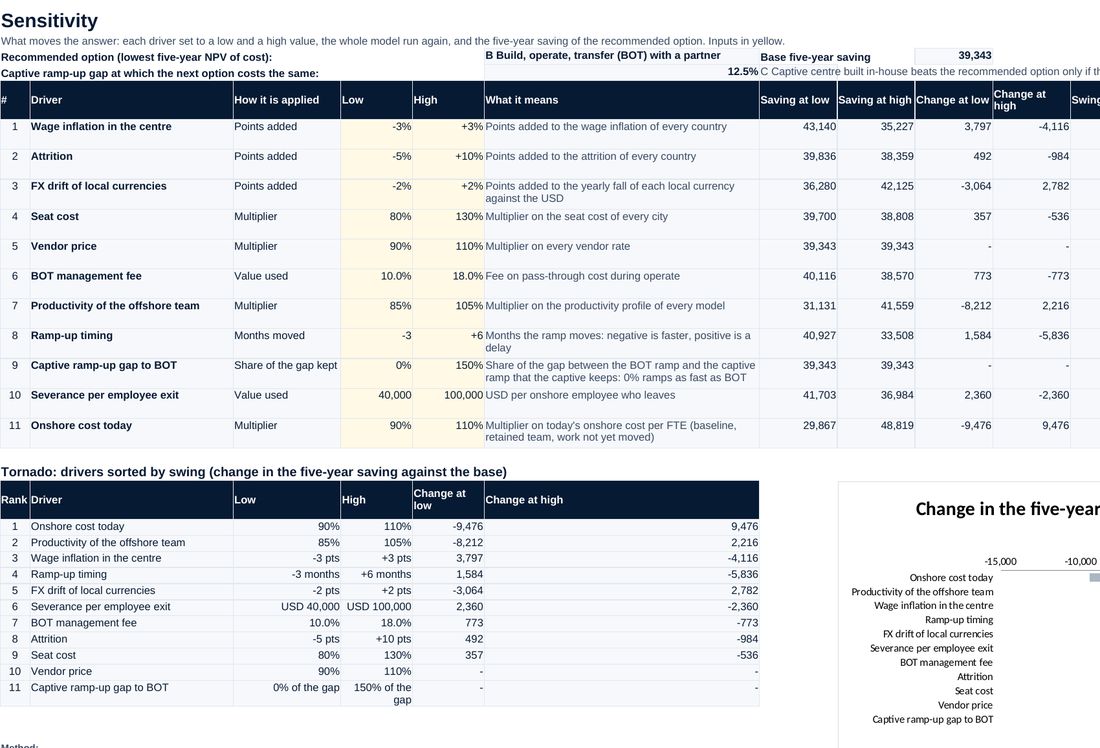
Eleven drivers set low and high, the whole model rerun for each, sorted by swing, and whether the answer changes.
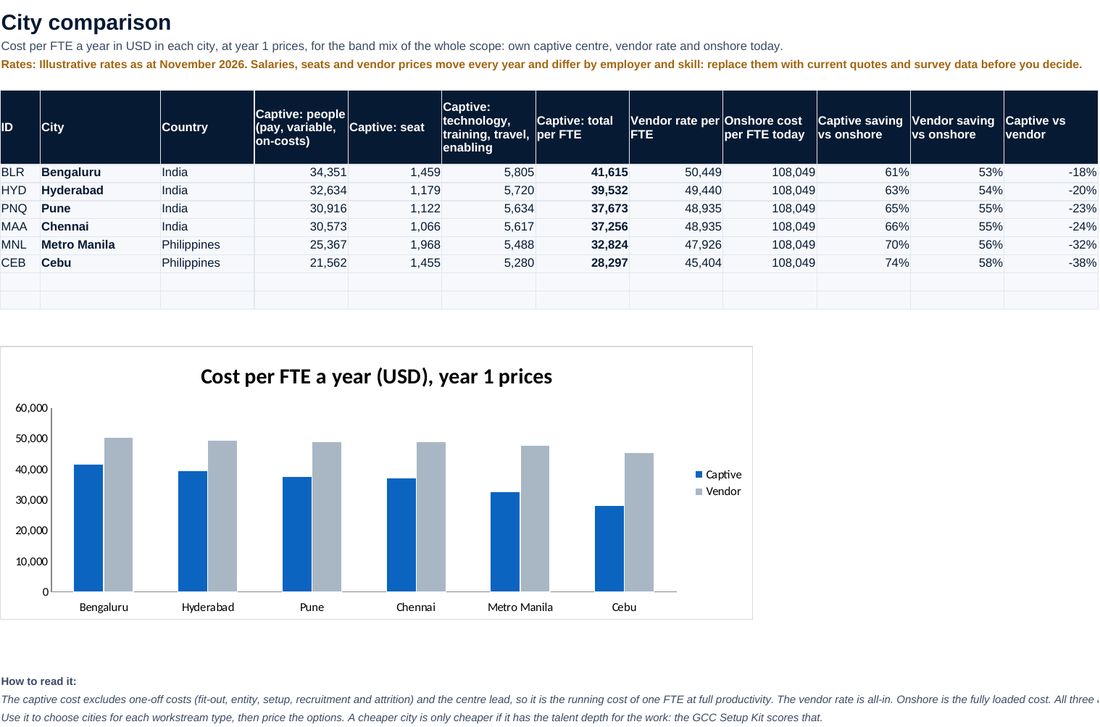
Captive, vendor and onshore cost per FTE in six cities for the band mix of your scope.
Screenshots of the workbook with its sample data, opened in a spreadsheet application.
A cost case the CFO can rebuild
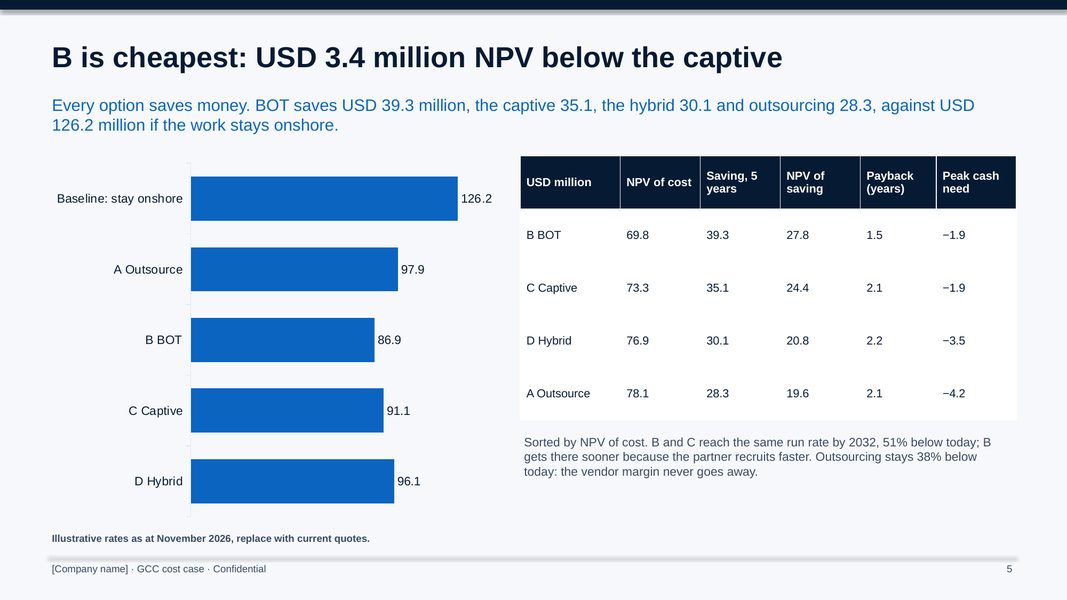
The sample company moves 220 FTE of applications, engineering, data, cyber, service desk and finance work that costs USD 23.8 million a year onshore. Every option saves money over five years, but not equally: a BOT centre with a Pune hub and a Metro Manila spoke saves USD 39.3 million, the captive 35.1, the hybrid 30.1 and outsourcing 28.3. BOT is USD 3.4 million NPV cheaper than the captive and pays back in 1.5 years, about 16 months after the 1 March 2028 start. The tornado shows onshore cost and productivity move the saving most. BOT stays cheapest in the low, mid and high rate scenarios and in every sensitivity case but one: a captive that closes more than 87% of its ramp-up gap to BOT would win.
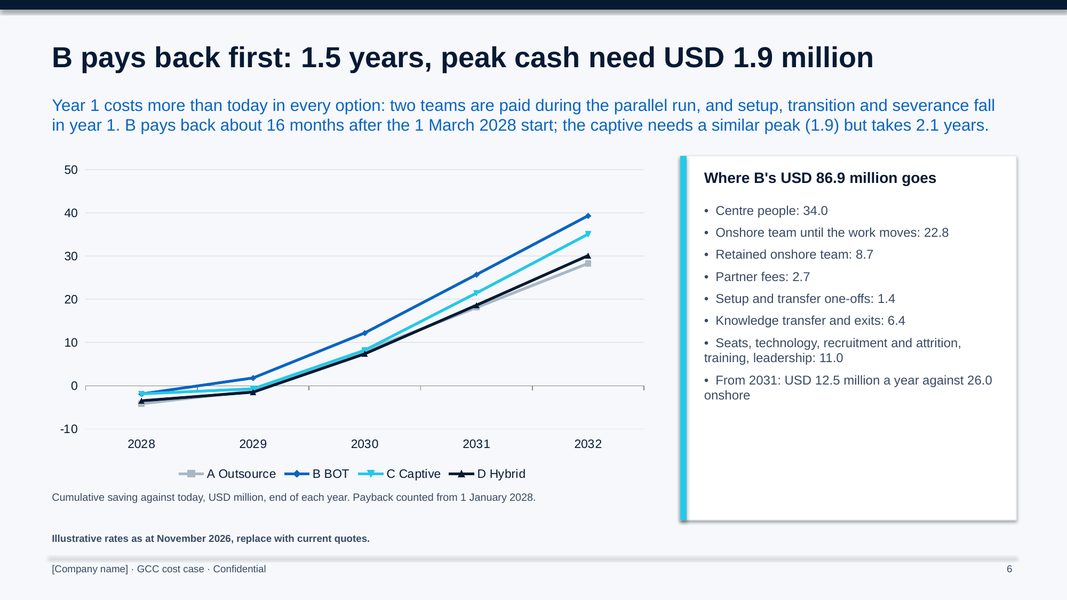
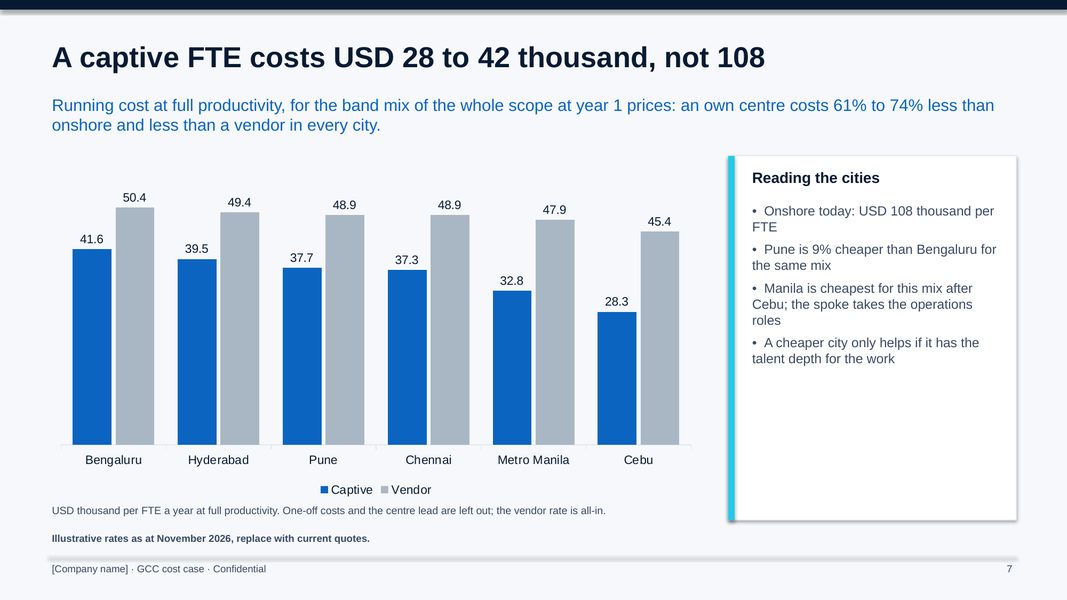
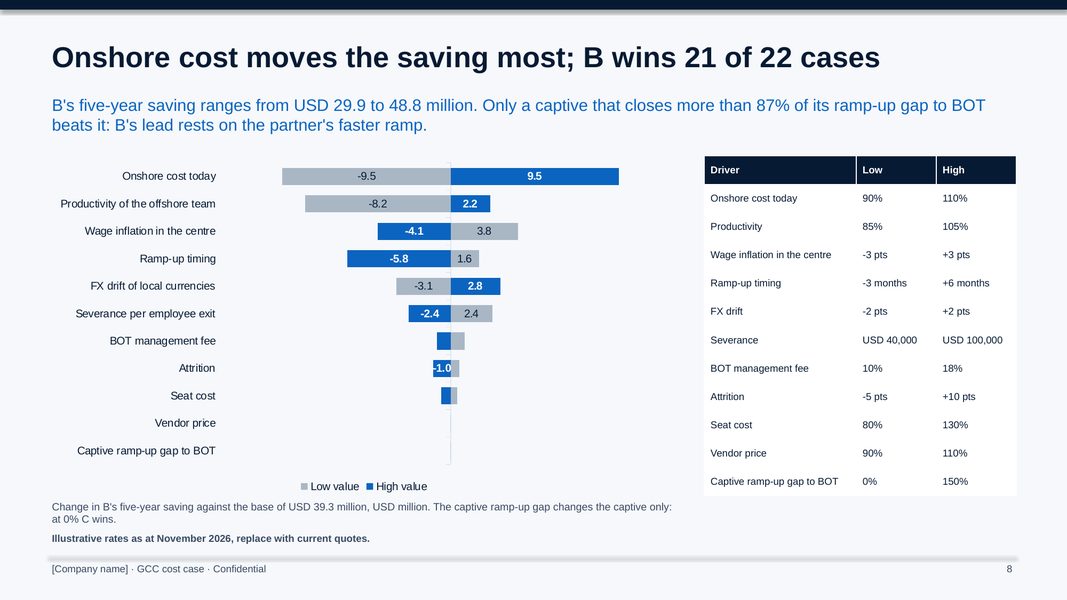
All figures shown are sample data.
The method, step by step
List the workstreams that could move, the FTE of work and the mix of role bands, agree the team that stays onshore, and shortlist a hub and a spoke from the city comparison.
Replace the illustrative rates with partner quotes and salary surveys, price the four options and read the payback and peak cash need.
Run the low, mid and high scenarios and the sensitivity tornado, and find the assumption that would change the answer.
Score what cost cannot decide (control, risk, speed, talent, exit) and take one page to the executive committee.
Who it is for
- CIOs weighing an offshore capability centre in India or the Philippines
- CFOs and finance business partners who must defend the numbers
- COOs and heads of shared services moving operations work offshore
- Advisers building a GCC cost case for a client (one licence per client organisation)
What you need
Excel, PowerPoint and Word, or compatible software. A first case takes about two weeks; replacing the rates with quotes takes one to two weeks more.
Free guides on this topic
Questions about the kit
Are the rates real market rates?
No. Every rate is an illustrative assumption as at November 2026 for a fictional company. Salaries, seats and vendor prices move every year and differ by employer and skill: replace them with current quotes and survey data before you decide.
Can we change the cities, the workstreams and the options?
Yes. Up to eight cities in two countries, up to 10 workstreams with their band mix, and for each of four options the model and city of every workstream, all by input or dropdown. Every rate and assumption is editable.
How is the tornado computed?
Each driver is set to a low and a high value and the whole model is run again for all four options, so the result is exact, not an approximation. The sheet also shows whether the cheapest option changes.
What do the paid GCC kits add?
The GCC Setup Kit takes the decision to a running centre: operating model selector, location scorecard, entity and legal tracker, roadmap, organisation, transition and governance. The GCC Partner RFP Pack selects and contracts the BOT or managed partner.
Is the company in the example real?
No. The manufacturer and its figures are fictional. Replace them with your own.
Is it really free?
Yes, for now. Download it, use it and adapt it inside your organisation. Please do not resell or republish it; send colleagues to this page instead.
Is it legal or financial advice?
No. The templates are practical starting points for management decisions. Have policies and contracts reviewed against the law that applies to your company.
Who can use it?
You and your colleagues, inside your own organisation. Advisers need one licence per client organisation. Please do not resell or republish it.