IT Budget Benchmark Kit
Published figures for IT spend range from under 3% to 12% of revenue, and a single number can justify a cut or a raise with equal confidence. This kit builds a benchmark that survives the CFO: a baseline on three scopes, the ratios, published figures recorded with their date, sample and statistic, a position and a confidence level for every comparison, and your own trend, business units and unit costs, all filled in for a worked example.
$89 $45 one-time, no subscription
Excel, PowerPoint and Word files. Yours to use and adapt inside your organisation. Delivered by email at once; 14-day refund promise.
13 working files, not a slide pack to read
Every file is editable and comes with a worked example for one fictional company, so you start from something, not from a blank page. Workbooks calculate as you type.
 Excel
IT budget benchmark workbook
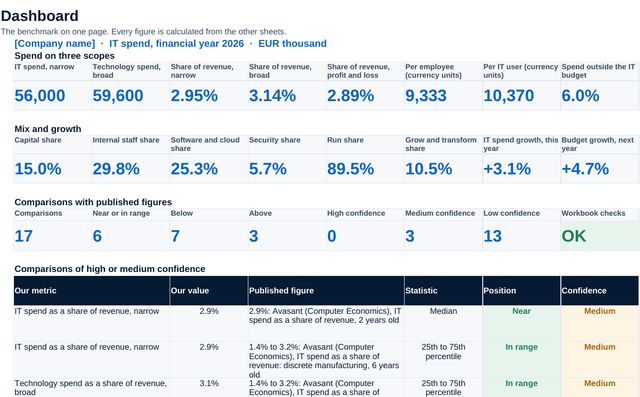
11 sheets: setup, the spend baseline line by line, 20 metrics on three scopes and the mix, the sources and the published figures taken from them, the comparison with position, flags and confidence, business units with corporate costs spread, a trend over four years and the budget, and unit costs against last year and peers. A dashboard pulls it together.
 PowerPoint
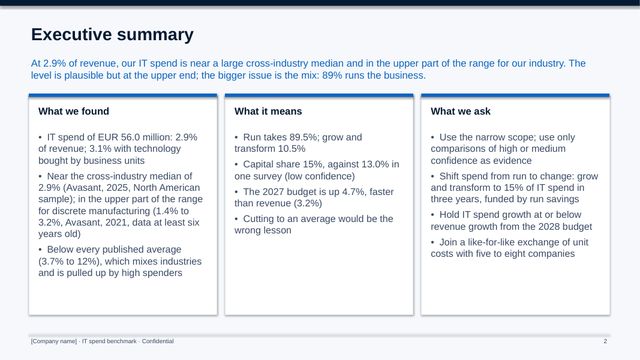
IT spend benchmark (executive committee)
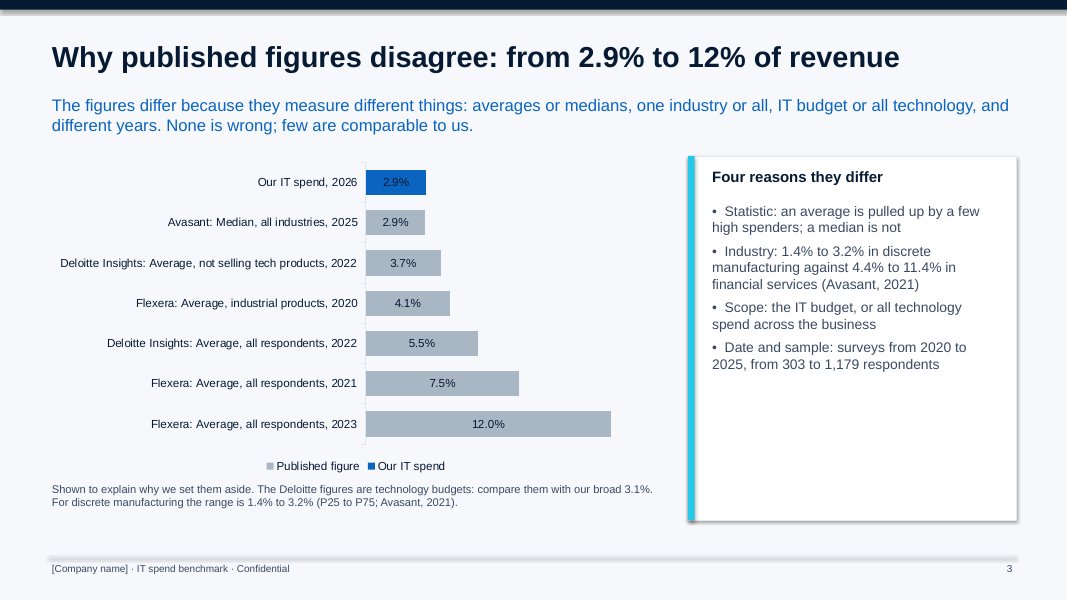
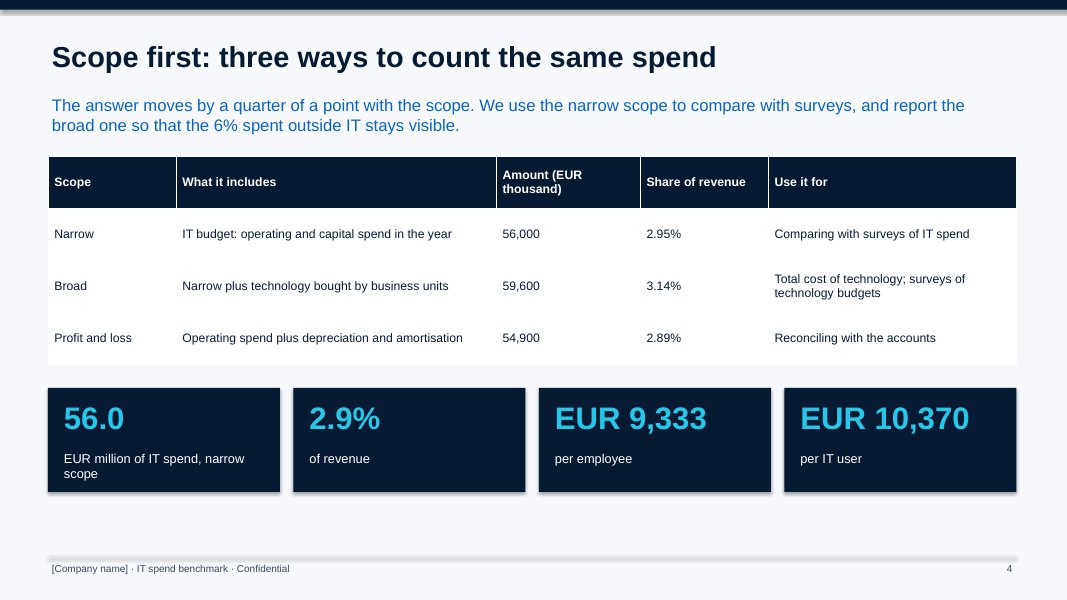
11 slides: why published figures disagree, the three scopes, where we stand, the mix, the trend, business units, unit costs, what a benchmark can and cannot tell, and the decisions.
 PowerPoint
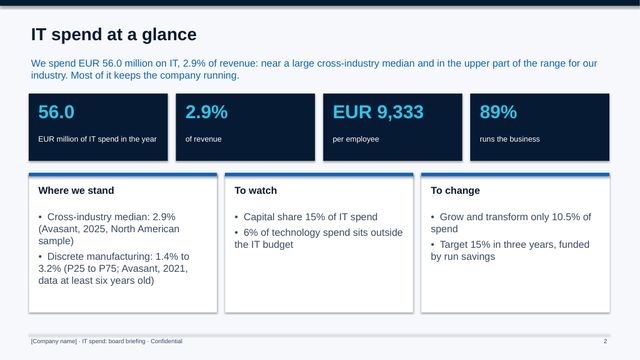
IT spend board briefing
5 slides: IT spend at a glance, why we do not compare with averages, where the money goes and what we are doing.
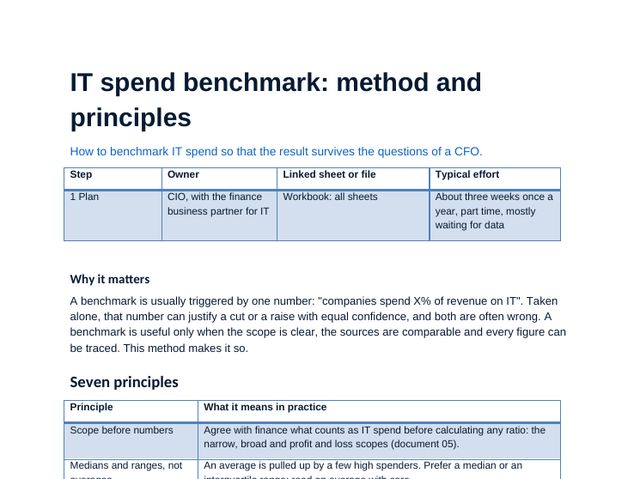 Word
Benchmark method and principles
Seven principles and the method in six steps.
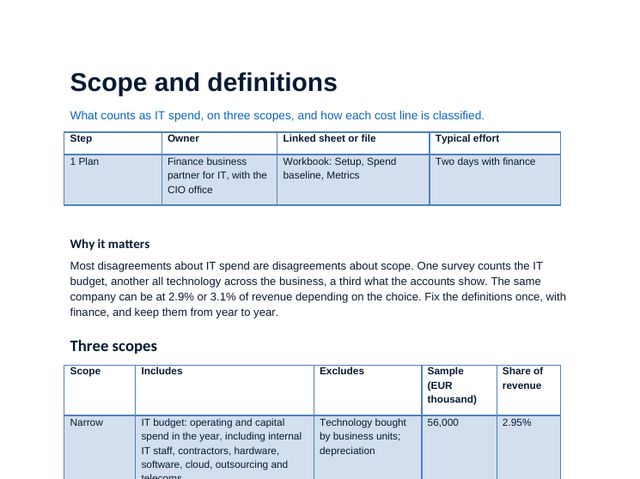 Word
Scope and definitions
The narrow, broad and profit and loss scopes, the classifications and the definitions that change the answer.
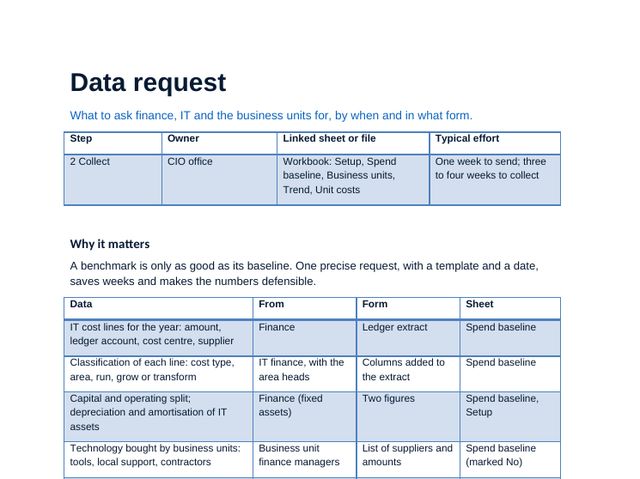 Word
Data request
What to ask finance, IT and the business units for, by when and in what form.
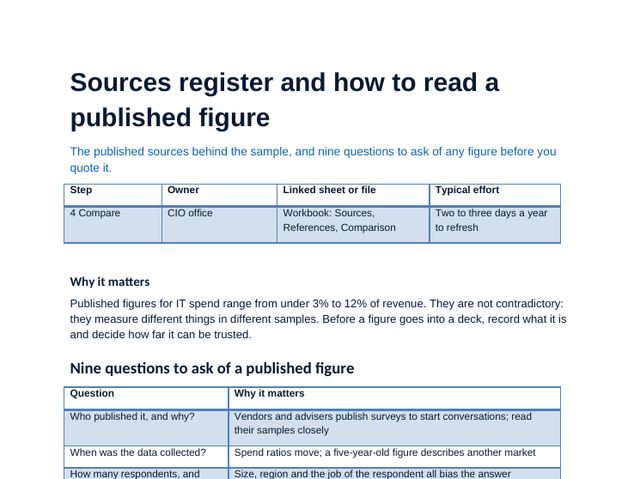 Word
Sources register
Nine questions to ask of any published figure, and the sources and figures behind the sample, with links.
 Word
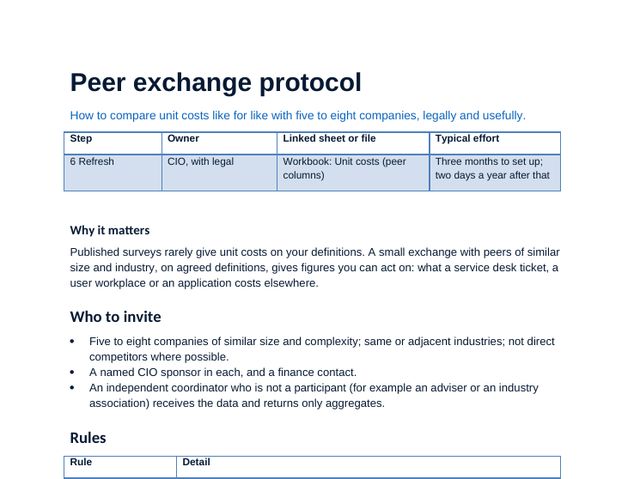
Peer exchange protocol
How to compare unit costs with five or more peers, on agreed definitions and within competition law.
 Word
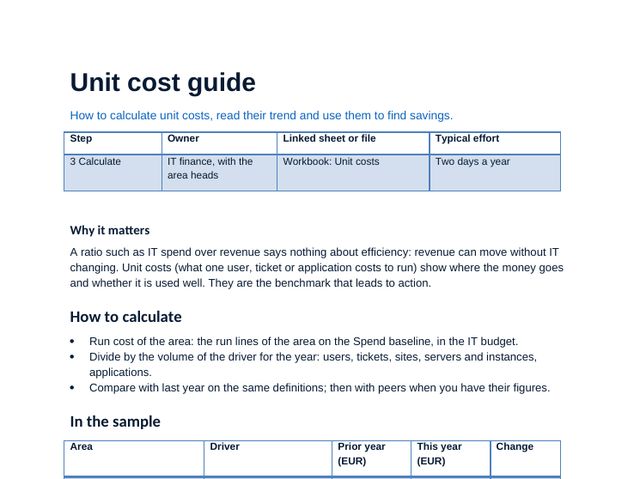
Unit cost guide
How to calculate unit costs, read their trend and use them to find savings.
 Word
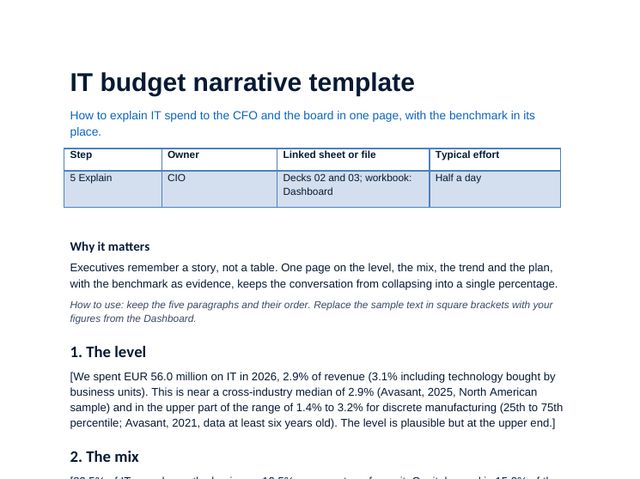
IT budget narrative template
One page for the CFO and the board: level, mix, trend, what the benchmark does not say, and the plan.
 Word
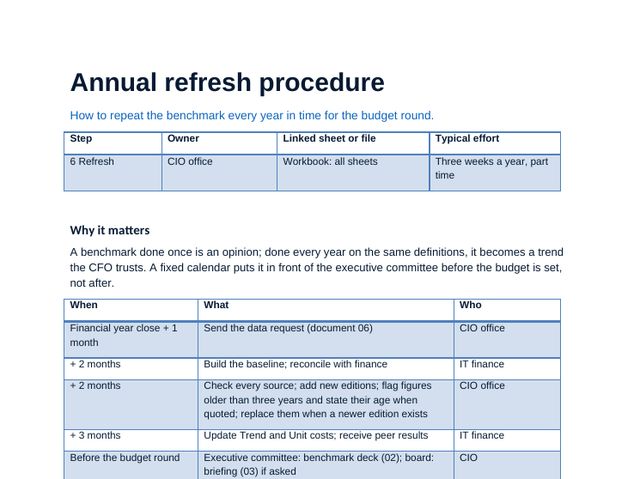
Annual refresh procedure
The yearly calendar and checklist, in time for the budget round.
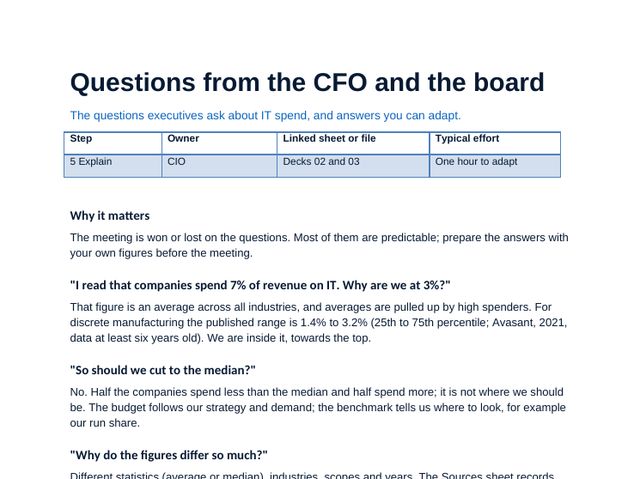 Word
Questions from the CFO and the board
The questions executives ask about IT spend, with answers to adapt.
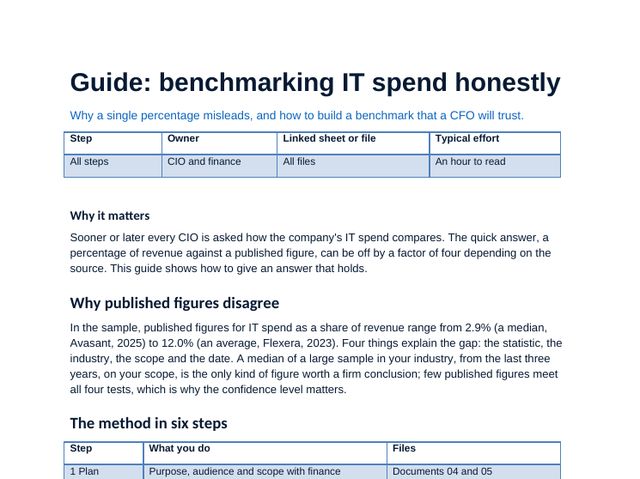 Guide
Benchmarking IT spend honestly
Why published figures disagree, the method, using the workbook and the mistakes to avoid.
IT budget benchmark workbook, sheet by sheet
The workbook carries the method: scores, choices and plans calculate as you type, and the dashboard and deck figures come from it. Click any image to see it full size.
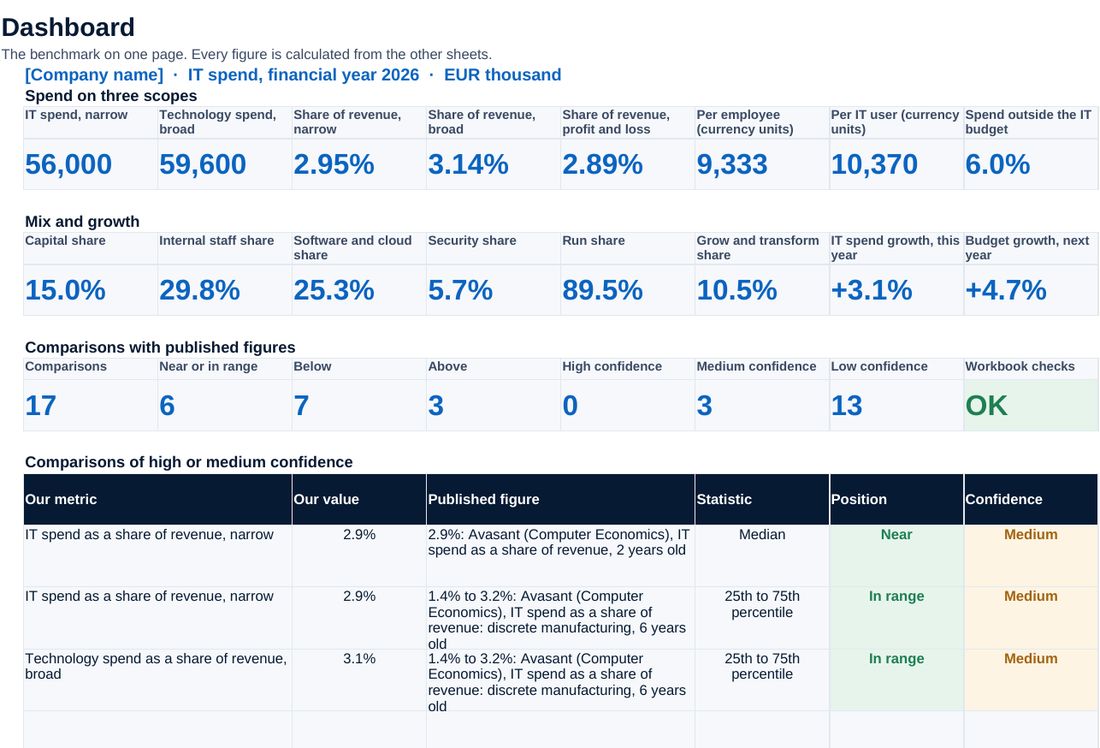
Spend on three scopes, the mix and growth, comparisons by position and confidence, the trend and the checks.
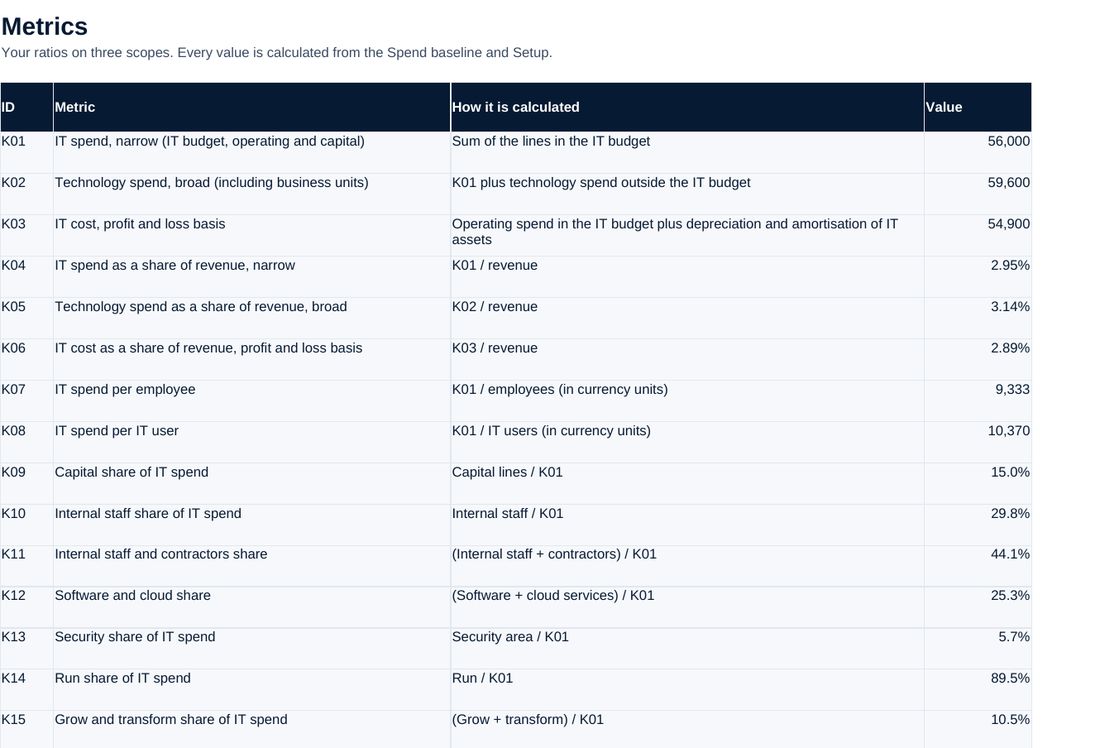
Twenty metrics on three scopes, and the mix by cost type and by run, grow and transform.
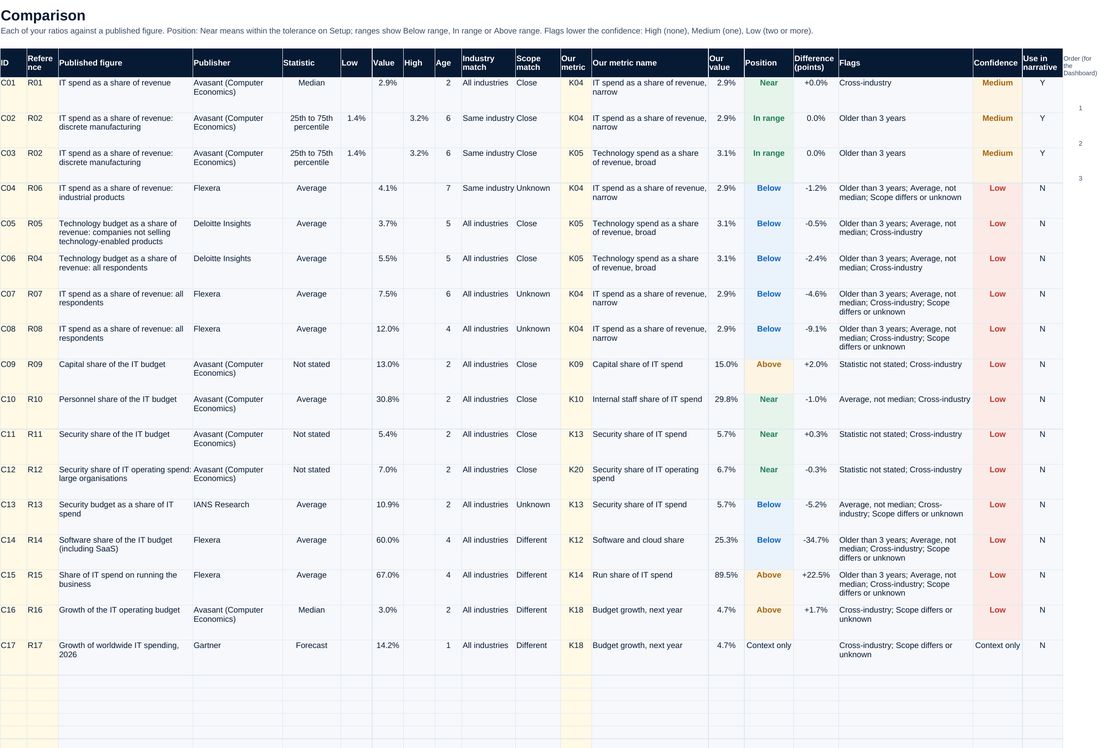
Each ratio against a published figure: position, difference, flags and confidence.
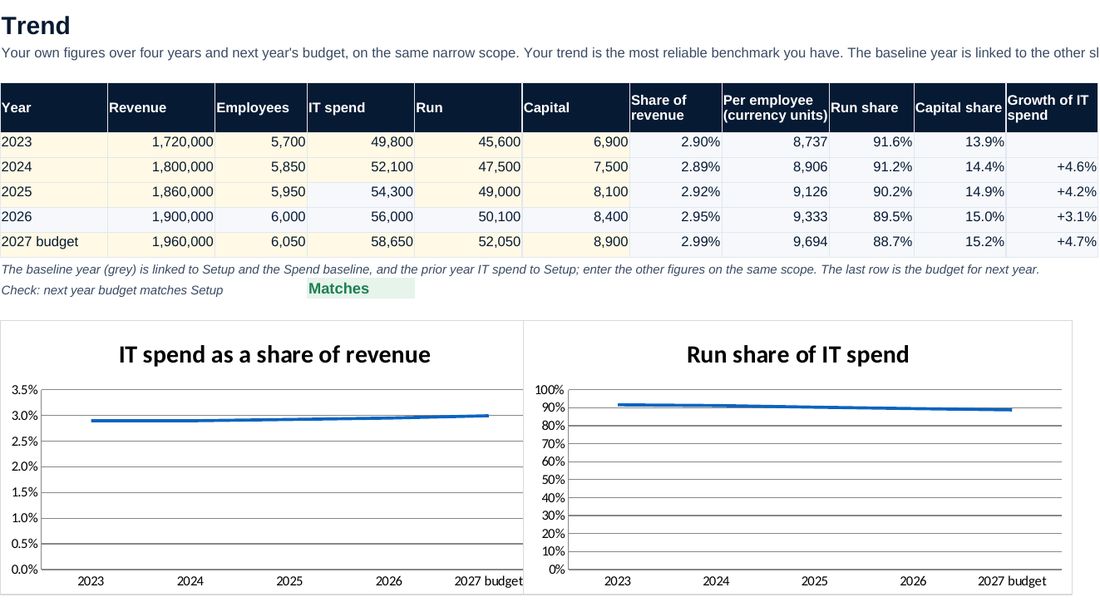
Four years of your own figures and next year's budget, on the same scope.
Screenshots of the workbook with its sample data, opened in a spreadsheet application.
A benchmark you can defend
Every published figure carries its publisher, date, sample and statistic, and every comparison a confidence level. In the sample, IT spend is 2.9% of revenue: near a large cross-industry median and in the upper part of the range for its industry, and below every published average, none of which is a reliable comparator. The useful findings are in the mix: 89% of spend runs the business and capital spend looks high.
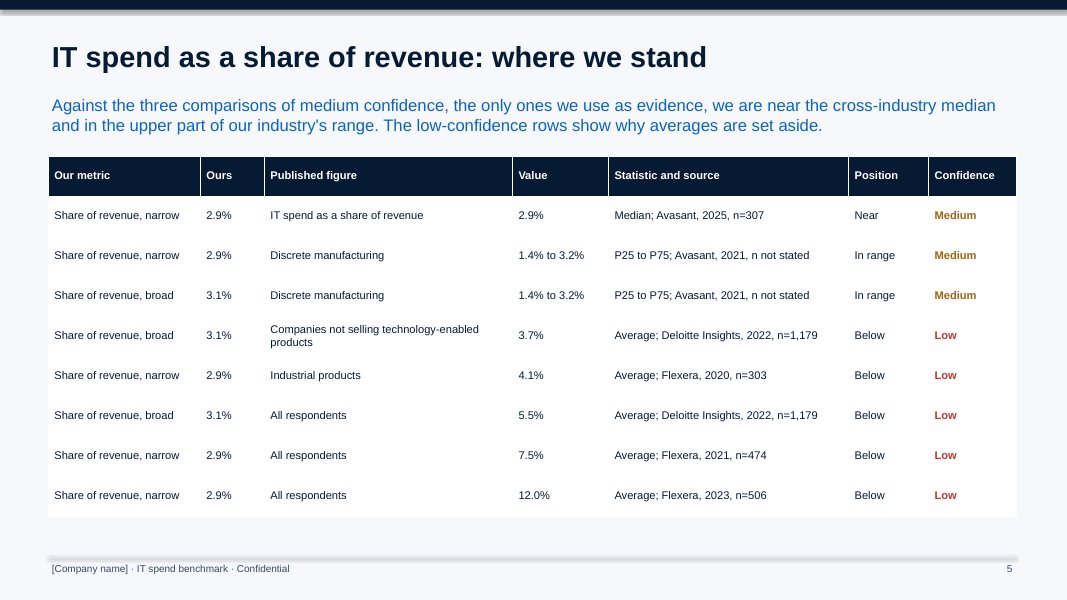
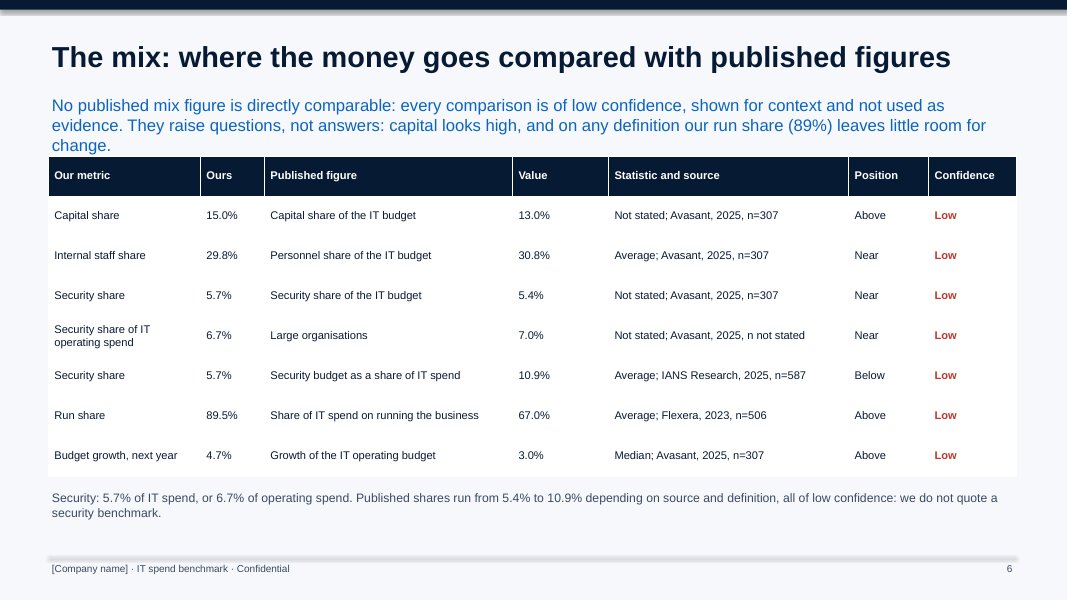
All figures shown are sample data.
The method, step by step
Agree the purpose and the scope with finance; send the data request.
Build the baseline, reconcile it to the ledger and calculate the ratios, trend and unit costs.
Check every source, add the published figures and read the position and confidence of each comparison.
Write the one-page narrative and present the benchmark before the budget round.
Who it is for
- CIOs asked how their IT spend compares
- CFOs and finance business partners for IT
- CIO office and IT finance leads preparing the budget
- Advisers benchmarking IT spend for a client (one licence per client organisation)
What you need
Excel, PowerPoint and Word, or compatible software. A first benchmark takes about six weeks, mostly waiting for data; the yearly refresh about three.
Free guides on this topic
Questions about the kit
Are the published figures real?
Yes. Each comes from a publisher's report or press release, recorded with its date, sample, population, statistic and link. Publishers revise their reports, so check each source before you quote it.
Why not just use the average for our industry?
Averages are pulled up by a few high spenders and free industry figures are often several years old. The kit shows medians and ranges where they exist and gives each comparison a confidence level.
Can we add our own sources or a paid benchmark?
Yes. Add the source and its figures on the Sources and References sheets; the comparison, position and confidence follow.
Is the company in the example real?
No. The manufacturer and its figures are fictional. Replace them with your own.
How do I get it?
Checkout is run by Creem, our reseller and merchant of record, which also handles tax and your invoice. As soon as the payment is confirmed we email you a private link to download the kit. Not what you expected? Ask within 14 days for a full refund.
Is it legal or financial advice?
No. The templates are practical starting points for management decisions. Have policies and contracts reviewed against the law that applies to your company.
Who can use it?
You and your colleagues, inside your own organisation. Advisers need one licence per client organisation. Please do not resell or republish it.